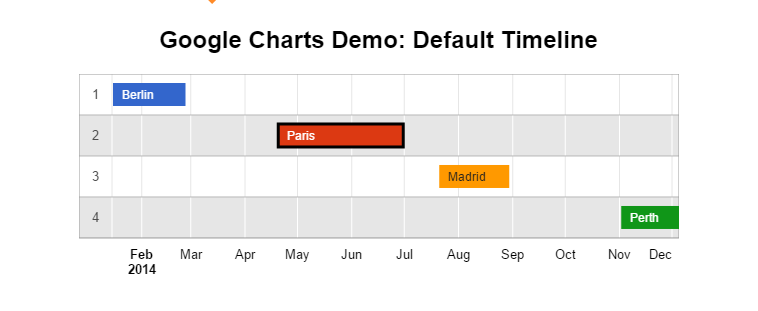
If you run a blog or website showcasing events in a chronological order, it is important to grab the readers’ attention as quickly as possible by displaying all the events vital information in an effective and interesting manner such as using timeline charts. In this Sitepoint tutorial, web developer Ashraff Hathibelagal teaches us how to use Google Charts to add professional looking timelines to your web pages. Google Charts allows us to use JavaScript to manipulate our charts data, appearance as well as adding interactivity, all of which are covered in this easy to follow tutorial and its accompanying demos. Click the button below to learn more.
comment 0